Numbers and figures and charts and graphs…
Highcharts

An interactive map that illustrates the growth in Hispanic voter turnout from 2000 to 2012. This map was created for News21 Voting Wars project.
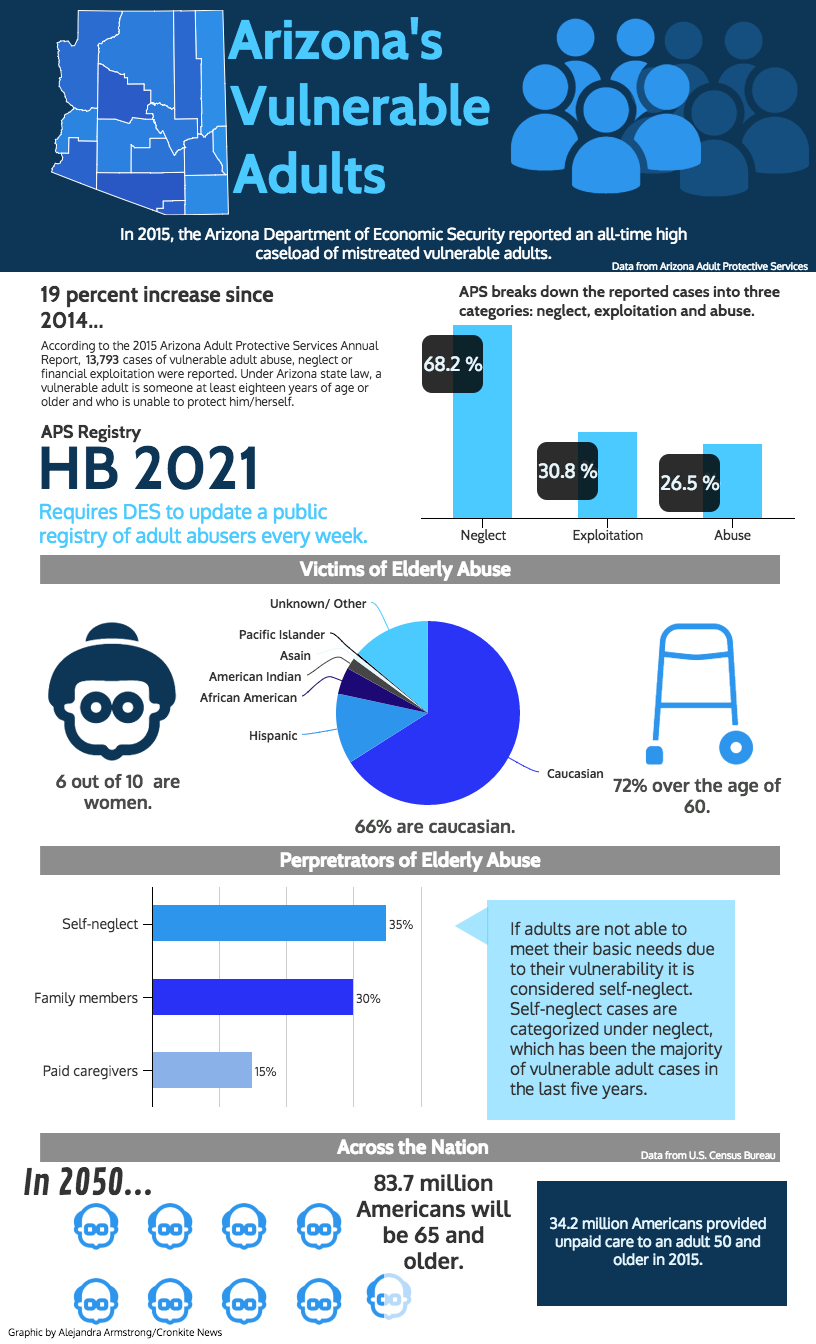
Venngage
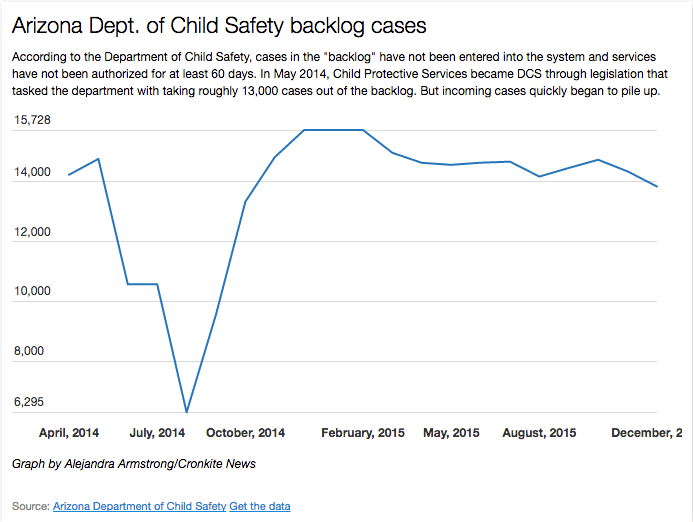
Datawrapper
An interactive map that illustrates the growth in Hispanic voter turnout from 2000 to 2012. This map was created for News21 Voting Wars project.
Datawrapper
